
According to the Centers for Disease Control and Prevention, cancer is the second leading cause of death in the United States, killing an estimated 605,213 people in 2021 alone. While lung, colon, and breast cancer are the most common, they are far from the deadliest forms of the disease.
Cancer researchers determine how deadly a cancer is by looking at the five-year survival rate – the number of people who have not died from their cancer five years after diagnosis. By this measure, mesothelioma is among the deadliest forms of cancer in the United States. Consider that the five-year survival rate of all cancers is 68 percent. Mesothelioma has a survival rate of around twelve percent.
While relatively rare, mesothelioma is an aggressive form of cancer with one primary case – asbestos exposure. Asbestos was widely used in construction, manufacturing, and fireproofing until the 1980s. While its use is now limited, the material can still be found in older homes, businesses, and even in schools and universities across the country.
Where then, are people at the highest risk of being exposed to asbestos and developing and succumbing to this deadly cancer? Using United States Cancer Statistics data from the CDC and the National Cancer Institute, we identified the states with both the highest and lowest rates of both new cases and deaths.
Learn More: What is Mesothelioma?
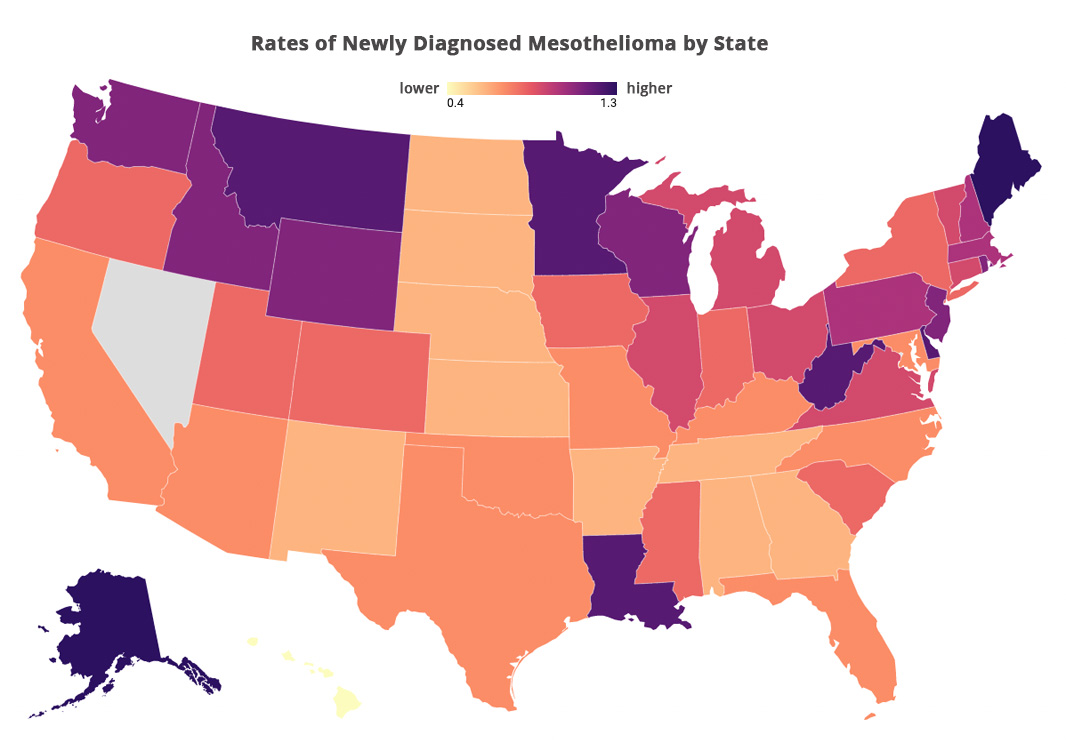
Map: Rates of New Mesothelioma and Mesothelioma Deaths by State
From 2015-2019, over 15,000 people were diagnosed with mesothelioma in the United States. The map below shows the age-adjusted rates of new cancer per 100,000 people by state. Alaska and Maine had the highest rate of new cancers with 1.3 per 100,000 people – nearly twice the rate for the U.S. overall (0.7). while Hawaii had the lowest rate with 0.4 per 100,000 people.
*Nevada is excluded as new mesothelioma diagnosis data was suppressed in the CDC data.
During the same time period, from 2015-2019, 12,431 people died from their cancer. Deleware had the highest rate of mesothelioma deaths, with 1.1 per 100,000 people – nearly twice that of the national average (0.6). Arkansas, Georgia, Hawaii, and South Dakota had the lowest rates of mesothelioma deaths with 0.4 per 100,000.
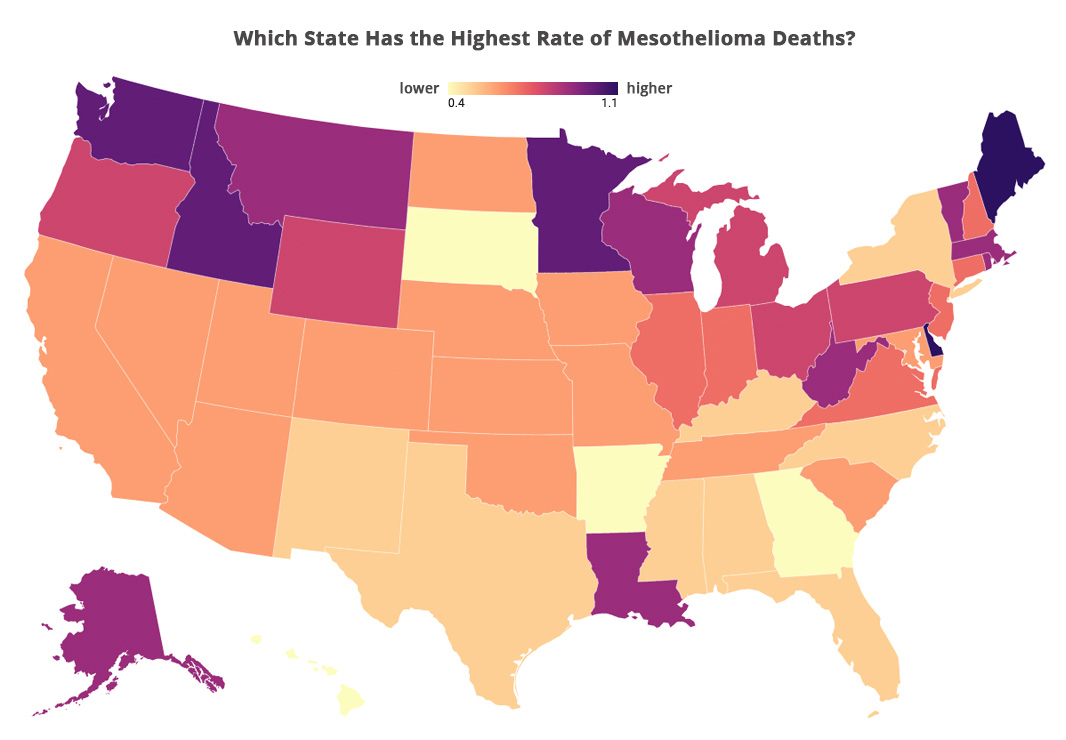
Interestingly, mesothelioma death rates have decreased across the board in the United States since 1999 – from 0.9 per 100,000 people to the current rate of 0.6. However, annual death counts have actually increased over that time. This phenomenon is likely the result of a steady increase in population, along with the long latency period of mesothelioma. With advances in treatment, the five-year survival rate has increased considerably during this time period as well – from just over six percent to twelve percent (though that figure depends on which stage of mesothelioma is diagnosed).
Ten States with the Highest Rates of Mesothelioma Diagnosis and Death
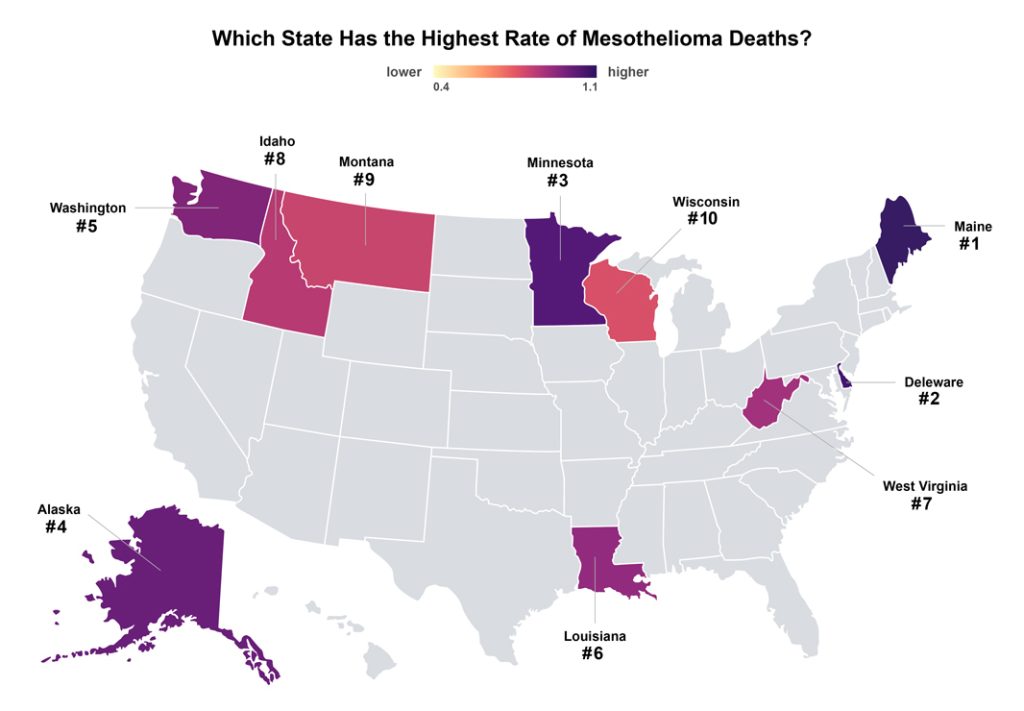
#1. Maine
- New Mesothelioma Cancer Rate: 1.3 per 100,000 (131 new cases)
- Mesothelioma Death Rate: 1.1 per 100,000 (106 deaths)
#2. Delaware
- New Mesothelioma Cancer Rate: 1.2 per 100,000 (72 new cases)
- Mesothelioma Death Rate: 1.1 per 100,000 (67 deaths)
#3. Minnesota
- New Mesothelioma Cancer Rate: 1.2 per 100,000 (373 new cases)
- Mesothelioma Death Rate: 1.1 per 100,000 (317 deaths)
#4. Alaska
- New Mesothelioma Cancer Rate: 1.3 per 100,000 (41 new cases)
- Mesothelioma Death Rate: 0.9 per 100,000 (28 deaths)
#5. Washington
- New Mesothelioma Cancer Rate: 1.1 per 100,000 (440 new cases)
- Mesothelioma Death Rate: 1.0 per 100,000 (396 deaths)
#6. Louisiana
- New Mesothelioma Cancer Rate: 1.2 per 100,000 (330 new cases)
- Mesothelioma Death Rate: 0.9 per 100,000 (252 deaths)
#7. West Virginia
- New Mesothelioma Cancer Rate: 1.2 per 100,000 (148 new cases)
- Mesothelioma Death Rate: 0.9 per 100,000 (114 deaths)
#8. Idaho
- New Mesothelioma Cancer Rate: 1.1 per 100,000 (107 new cases)
- Mesothelioma Death Rate: 1.0 per 100,000 (94 deaths)
#9. Montana
- New Mesothelioma Cancer Rate: 1.2 per 100,000 (85 new cases)
- Mesothelioma Death Rate: 0.9 per 100,000 (65 deaths)
#10. Wisconsin
- New Mesothelioma Cancer Rate: 1.1 per 100,000 (393 new cases)
- Mesothelioma Death Rate: 0.8 per 100,000 (338 deaths)
Ten States with the Lowest Incidence of Mesothelioma Diagnosis and Death
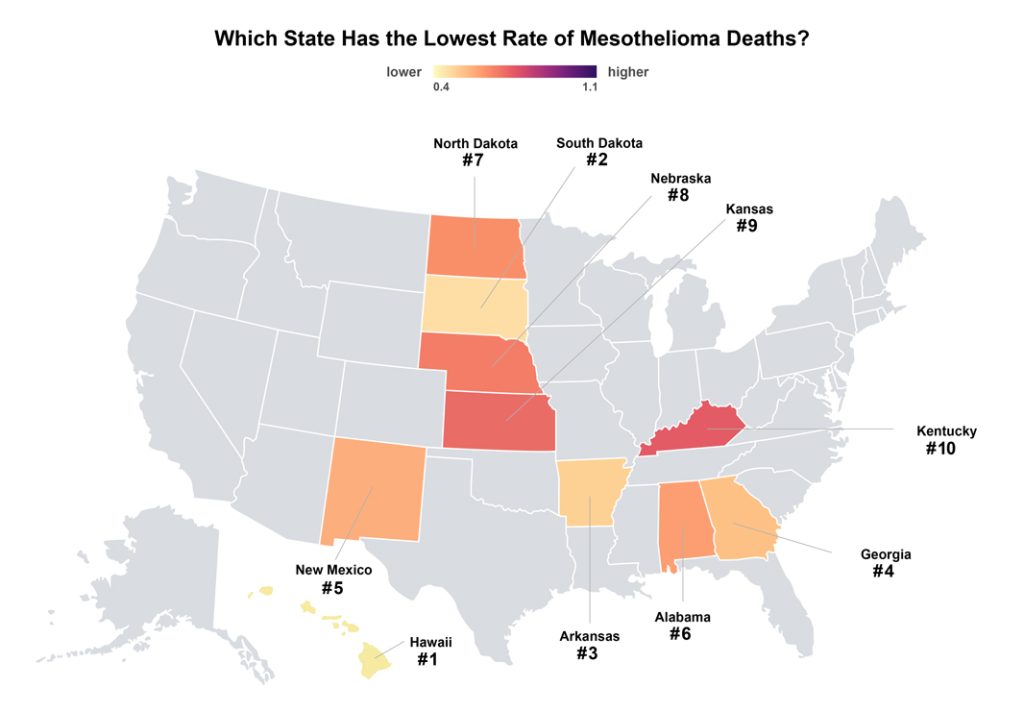
#1. Hawaii
- New Mesothelioma Cancer Rate: 0.4 per 100,000 (38 new cases)
- Mesothelioma Death Rate: 0.4 per 100,000 (36 deaths)
#2. South Dakota
- New Mesothelioma Cancer Rate: 0.6 per 100,000 (31 new cases)
- Mesothelioma Death Rate: 0.4 per 100,000 (25 deaths)
#3. Arkansas
- New Mesothelioma Cancer Rate: 0.6 per 100,000 (116 new cases)
- Mesothelioma Death Rate: 0.4 per 100,000 (85 deaths)
#4. Georgia
- New Mesothelioma Cancer Rate: 0.6 per 100,000 (298 new cases)
- Mesothelioma Death Rate: 0.4 per 100,000 (226 deaths)
#5. New Mexico
- New Mesothelioma Cancer Rate: 0.6 per 100,000 (80 new cases)
- Mesothelioma Death Rate: 0.5 per 100,000 (70 deaths)
#6. Alabama
- New Mesothelioma Cancer Rate: 0.6 per 100,000 (184 new cases)
- Mesothelioma Death Rate: 0.5 per 100,000 (140 deaths)
#7. North Dakota
- New Mesothelioma Cancer Rate: 0.6 per 100,000 (29 new cases)
- Mesothelioma Death Rate: 0.6 per 100,000 (27 deaths)
#8. Nebraska
- New Mesothelioma Cancer Rate: 0.6 per 100,000 (69 new cases)
- Mesothelioma Death Rate: 1.0 per 100,000 (61 deaths)
#9. Kansas
- New Mesothelioma Cancer Rate: 0.6 per 100,000 (106 new cases)
- Mesothelioma Death Rate: 0.6 per 100,000 (103 deaths)
#10. Kentucky
- New Mesothelioma Cancer Rate: 0.7 per 100,000 (175 new cases)
- Mesothelioma Death Rate: 0.5 per 100,000 (138 deaths)
Table: Mesothelioma Data for all States
The table below shows both the age-adjusted rates and counts of both new mesothelioma cases and mesothelioma deaths for each state from the years 2015-2019 (the latest years available from the CDC).
| State | New Cancer Rate | Case Count | Death Rate | Death Count |
|---|---|---|---|---|
| U.S. Overall* | 0.7 | 15,485 | 0.6 | 12,431 |
| Alabama | 0.6 | 184 | 0.5 | 140 |
| Alaska | 1.3 | 41 | 0.9 | 28 |
| Arizona | 0.7 | 327 | 0.6 | 282 |
| Arkansas | 0.6 | 116 | 0.4 | 85 |
| California | 0.7 | 1579 | 0.6 | 1179 |
| Colorado | 0.8 | 227 | 0.6 | 183 |
| Connecticut | 0.9 | 210 | 0.7 | 174 |
| Delaware | 1.2 | 72 | 1.1 | 67 |
| District of Columbia | Data Suppressed | Data Suppressed | Data Suppressed | Data Suppressed |
| Florida | 0.7 | 1146 | 0.5 | 831 |
| Georgia | 0.6 | 298 | 0.4 | 226 |
| Hawaii | 0.4 | 38 | 0.4 | 36 |
| Idaho | 1.1 | 107 | 1 | 94 |
| Illinois | 0.9 | 634 | 0.7 | 491 |
| Indiana | 0.8 | 325 | 0.7 | 285 |
| Iowa | 0.8 | 163 | 0.6 | 127 |
| Kansas | 0.6 | 106 | 0.6 | 103 |
| Kentucky | 0.7 | 175 | 0.5 | 138 |
| Louisiana | 1.2 | 330 | 0.9 | 252 |
| Maine | 1.3 | 131 | 1.1 | 106 |
| Maryland | 0.7 | 249 | 0.6 | 188 |
| Massachusetts | 1 | 405 | 0.9 | 361 |
| Michigan | 0.9 | 563 | 0.8 | 508 |
| Minnesota | 1.2 | 373 | 1 | 317 |
| Mississippi | 0.8 | 134 | 0.5 | 92 |
| Missouri | 0.7 | 275 | 0.6 | 239 |
| Montana | 1.2 | 85 | 0.9 | 65 |
| Nebraska | 0.6 | 69 | 0.6 | 61 |
| Nevada | Data Suppressed | Data Suppressed | 0.6 | 96 |
| New Hampshire | 1 | 86 | 0.7 | 65 |
| New Jersey | 1.1 | 575 | 0.7 | 398 |
| New Mexico | 0.6 | 80 | 0.5 | 70 |
| New York | 0.8 | 916 | 0.5 | 646 |
| North Carolina | 0.7 | 390 | 0.5 | 292 |
| North Dakota | 0.6 | 29 | 0.6 | 27 |
| Ohio | 0.9 | 650 | 0.8 | 573 |
| Oklahoma | 0.7 | 156 | 0.6 | 135 |
| Oregon | 0.8 | 213 | 0.8 | 203 |
| Pennsylvania | 1 | 874 | 0.8 | 722 |
| Rhode Island | 1.1 | 70 | 0.9 | 59 |
| South Carolina | 0.8 | 252 | 0.6 | 200 |
| South Dakota | 0.6 | 31 | 0.4 | 25 |
| Tennessee | 0.6 | 259 | 0.6 | 226 |
| Texas | 0.7 | 947 | 0.5 | 698 |
| Utah | 0.8 | 106 | 0.6 | 73 |
| Vermont | 0.9 | 38 | 0.9 | 36 |
| Virginia | 0.9 | 421 | 0.7 | 350 |
| Washington | 1.1 | 440 | 1 | 396 |
| West Virginia | 1.2 | 148 | 0.9 | 114 |
| Wisconsin | 1.1 | 393 | 0.9 | 338 |
| Wyoming | 1.1 | 36 | 0.8 | 24 |
*Both data points for the District of Columbia and new cancer data for Nevada were suppressed.
Mesothelioma by U.S. County
Below, we list the ten U.S. counties with the highest rates of mesothelioma diagnosis and death. All ten have death and diagnosis rates significantly higher than those of the states they are in and are at least double the national rate of new cancer diagnosis. Jefferson Parish had the highest rate of new mesothelioma cancer diagnoses in the United States, along with the second highest rate of mesothelioma deaths. In fact, it had a new cancer diagnosis rate more than double that of Louisiana and 3.5 times the national average. New London County has the highest mesothelioma death rate of any county in the United States at 2.2 per 100,00 people. Kitsap County, Washington is the only west coast county among the top ten and is tied for the second-highest rate of new cancers with Jackson County, Mississippi.
*Data for counties with fewer than 16 cases (or deaths) were suppressed, therefore we were unable to identify the counties with the lowest rates.
The Ten U.S. Counties with the Highest Rates of Mesothelioma Diagnosis and Death
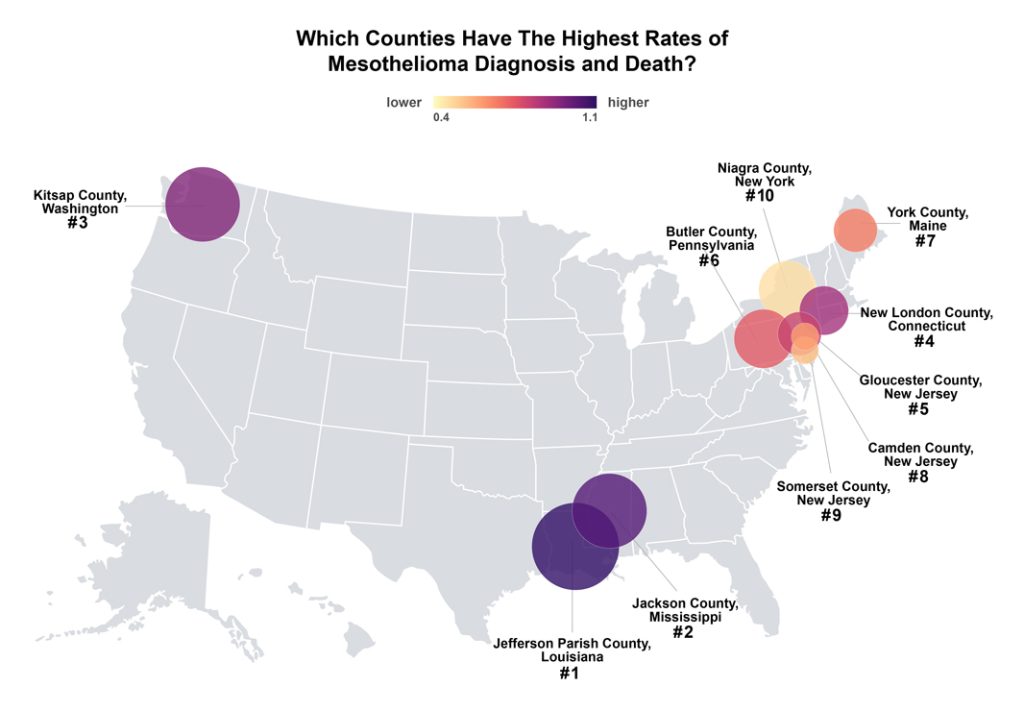
#1. Jefferson Parish, Louisiana
Population: 2,177,527
- New Mesothelioma Cancer Rate: 2.6 per 100,000
- Mesothelioma Death Rate: 2.1 per 100,000
#2. Jackson County, Mississippi
Population: 720,002
- New Mesothelioma Cancer Rate: 2.4 per 100,000
- Mesothelioma Death Rate: 2.1 per 100,000
#3. Kitsap County, Washington
Population: 1,331,404
- New Mesothelioma Cancer Rate: 2.4 per 100,000
- Mesothelioma Death Rate: 2.0 per 100,000
#4. New London County, Connecticut
Population: 1,339,159
- New Mesothelioma Cancer Rate: 2.1 per 100,000
- Mesothelioma Death Rate: 2.2 per 100,000
#5. Gloucester County, New Jersey
Population: 1,456,501
- New Mesothelioma Cancer Rate: 2.3 per 100,000
- Mesothelioma Death Rate: 1.7 per 100,000
#6. Butler County, Pennsylvania
Population: 935,900
- New Mesothelioma Cancer Rate: 2.2 per 100,000
- Mesothelioma Death Rate: 1.5 per 100,000
#7. York County, Maine
Population: 1,022,712
- New Mesothelioma Cancer Rate: 1.9 per 100,000
- Mesothelioma Death Rate: 1.5 per 100,000
#8. Camden County, New Jersey
Population: 2,534,555
- New Mesothelioma Cancer Rate: 1.9 per 100,000
- Mesothelioma Death Rate: 1.4 per 100,000
#9. Somerset County, New Jersey
Population: 1,651,105
- New Mesothelioma Cancer Rate: 1.8 per 100,000
- Mesothelioma Death Rate: 1.5 per 100,000
#10. Niagara County, New York
Population: 1,054,720
- New Mesothelioma Cancer Rate: 1.6 per 100,000
- Mesothelioma Death Rate: 1.6 per 100,000
How To Reduce Your Risk
Exposure to asbestos causes most cases of mesothelioma. In general, people are exposed by breathing in tiny asbestos fibers when the materials are disturbed. Statistics show that most people will not develop mesothelioma, it is important to avoid exposure to asbestos if possible.
Because asbestos was so widely used before the 1980s, many older homes and buildings still contain asbestos. If you live in an older home, asbestos may be present in pipe and furnace insulation, siding, popcorn ceilings, attic insulation, and flooring. Avoid disturbing those materials and speak with a local agency or certified asbestos contractor if the materials need to be replaced or you plan to renovate your home.
If you work around asbestos-containing materials, always wear the proper personal protective equipment and get training for handling asbestos if possible. Workers in some industries are more likely to be affected than others. This includes military veterans, shipyard workers, construction workers, or even educators and school employees. If your workplace contains asbestos and you believe that it is causing harm, you should tell your employer or health and safety representative. If that fails to resolve your concern you should contact the work health and safety regulator in your state.
Data and Methodology
Mesothelioma data for each state and county reflect the years 2015-2019 and were provided by the U.S. Department of Health and Human Services, Centers for Disease Control and Prevention, and the National Cancer Institute.
State and county rankings were determined by a composite ranking of death rates and rates of new cancer, ties were broken by the total number of deaths, then the total number of new cases.
